
Pricing Team Point Totals in NBA Matchups
I stumbled into totals betting after a frustrating stretch where I kept picking the right team to win but losing on the spread. A friend suggested I try over/under markets instead, and the shift changed how I approach NBA analysis entirely. Instead of predicting a winner, you predict whether the combined score of both teams will finish above or below a number set by the bookmaker.
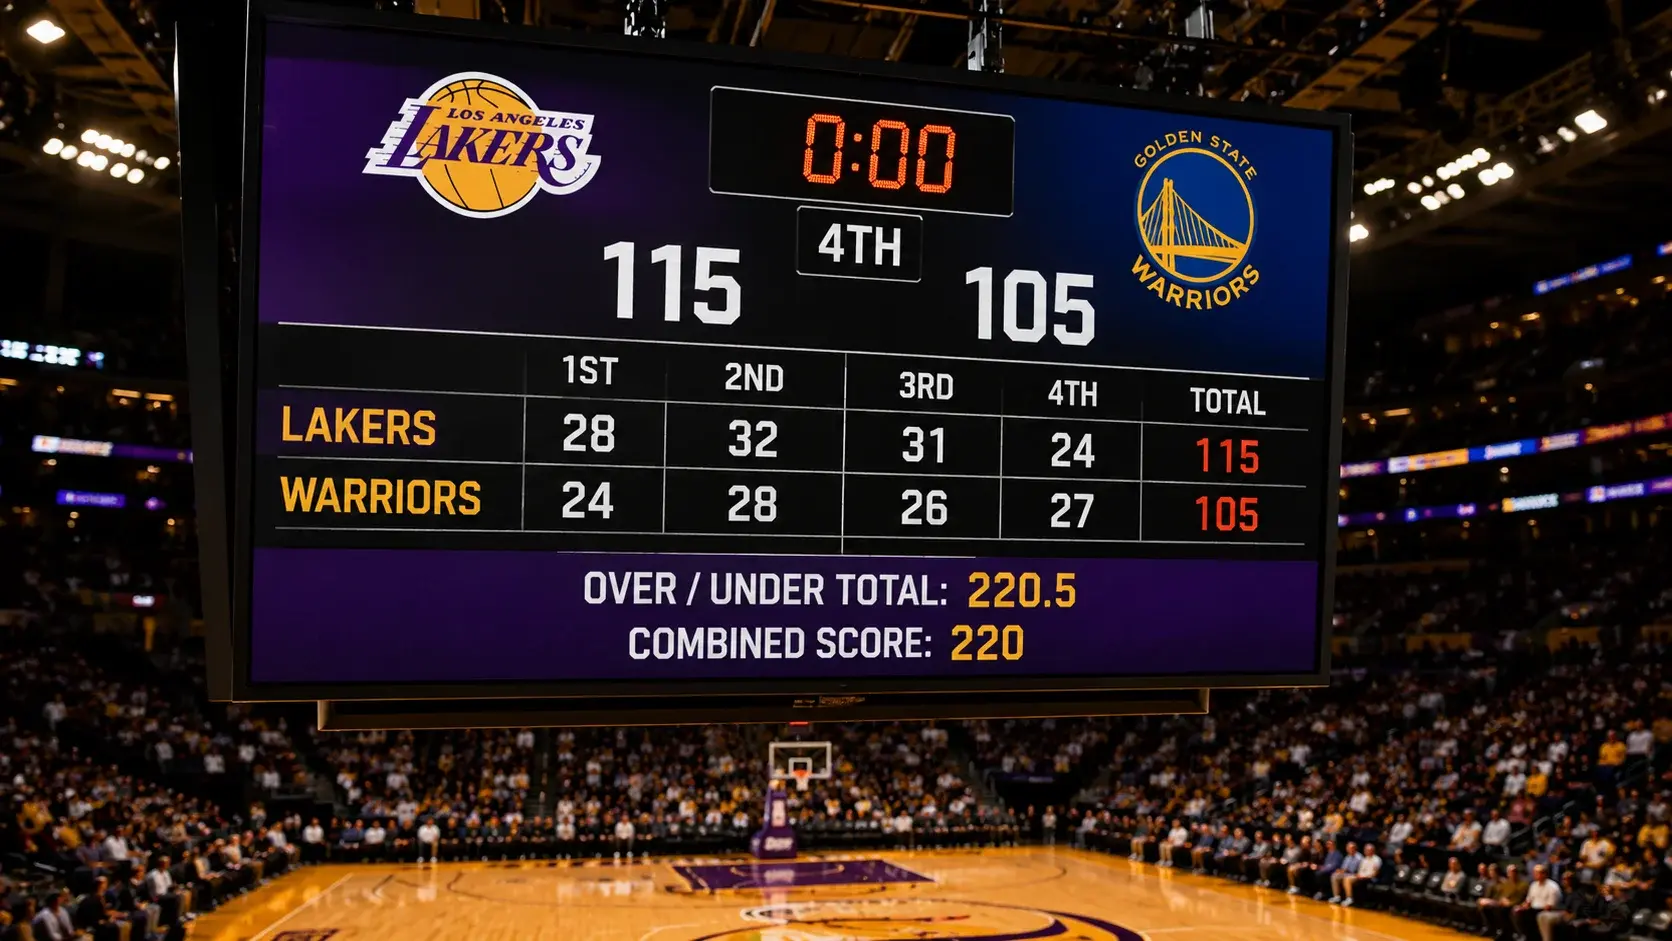
A typical NBA totals line might read: Over 224.5 at 1.91, Under 224.5 at 1.91. If the final score is 115-112, the combined total is 227 — the over wins. If it finishes 105-98, the total is 203 — the under wins. The half-point (.5) eliminates the possibility of a push, so every game produces a winner.
More than 1.3 billion hours of live NBA broadcasting were consumed globally in the 2025-26 season, a 93% increase year on year. That explosion of viewership means more data, more analysis, and more sophisticated totals markets. What was once a secondary market is now where some of the sharpest NBA betting action takes place, because totals are driven by measurable, predictable variables rather than the chaotic coin-flip of who wins a close game.
Pace Factor: The Engine Behind Every NBA Total
If you want to beat totals markets, you need to understand pace. Pace measures the number of possessions a team uses per 48 minutes, and it is the single most important variable in determining whether a game goes over or under.
A team that plays at a pace of 102 possessions per game creates roughly 10 more scoring opportunities per game than a team at 92. When two high-pace teams meet — say, both running at 100-plus possessions — the total inflates because more possessions mean more shots, more free throws, and more points. When two grinding, defensive-minded teams collide at 94 possessions each, the total drops accordingly.
The average NBA salary for the 2025-26 season sits at $10.54 million, with a salary cap of $154.647 million. Why does that matter for totals? Because roster construction follows financial incentives. Teams investing heavily in offensive talent tend to play faster and score more, while teams built around defensive anchors and low-salary role players often grind out lower-scoring games. Tracking how teams allocate their cap space gives you an indirect read on their pace tendencies.
I check pace data before every NBA betting session. The gap between the fastest and slowest teams in a given season can be fifteen possessions per game — that is a massive difference when translated into expected combined scores. Two fast teams meeting might warrant a total of 230 or higher, while two slow teams might justify 210 or lower. The bookmaker sets the line somewhere between, and your job is to determine whether the pace matchup favours the over or under more than the line already accounts for.
Schedule Context: Altitude, Arena Conditions, and Travel
Pace is not the only variable. NBA games do not occur in a vacuum — they happen on specific nights, in specific arenas, after specific travel schedules. These contextual factors influence scoring in ways that totals markets sometimes lag in pricing.
Denver’s altitude is the classic example. Games at Ball Arena, sitting over 5,000 feet above sea level, have historically produced slightly different scoring patterns for visiting teams. Players fatigue faster, and the thin air affects shooting mechanics subtly over four quarters. Whether this translates into consistently higher or lower totals depends on the visiting team’s conditioning and the specific matchup, but it is a variable worth tracking.
Travel distance and time zones matter too. A team flying from Miami to Portland for a back-to-back loses recovery time, and fatigued teams tend to shoot worse from three-point range and commit more turnovers. Both effects push scoring in unpredictable directions — turnovers create fast-break points for the opponent, but poor shooting suppresses overall scoring. The net effect varies by team, which is why blunt rules like “always bet the under on back-to-backs” do not hold up over large samples.
Arena-specific factors like court speed and lighting conditions are harder to quantify, but I have noticed over the years that certain venues consistently produce scoring patterns that deviate from what pace data alone would predict. Keeping a log of live betting results by venue has helped me spot these tendencies and adjust my totals approach accordingly.
First-Half and Quarter Totals: Slicing the Game
Full-game totals are the headline market, but some of my most consistent results come from first-half and first-quarter totals. These sub-markets let you target specific portions of the game where patterns are more pronounced and variance is compressed.
First quarters tend to follow starter-heavy rotations. If both teams start five high-usage offensive players, the first-quarter total often runs hot. Benches enter in the second quarter, and scoring patterns shift as rotations deepen. By isolating the first quarter, you reduce the variables to a smaller, more predictable set.
First-half totals are useful because they capture the game before coaches make significant tactical adjustments. Most head coaches save their defensive adjustments for halftime, which means first-half scoring often reflects the natural pace matchup more accurately than the full game. Second halves introduce more variance as coaches adapt, foul trouble reshuffles rotations, and late-game situations produce intentional fouling and clock management that distort scoring.
The key principle is this: the shorter the window you are betting on, the less noise enters the equation. A first-quarter total depends primarily on starting lineup pace and offensive tendencies — variables you can research in advance. A full-game total depends on all of that plus substitution patterns, in-game adjustments, foul trouble, injuries, and random variance across 48 minutes. Neither is inherently easier, but they reward different types of analysis, and having both available lets you target the market where your research gives you the strongest edge.