

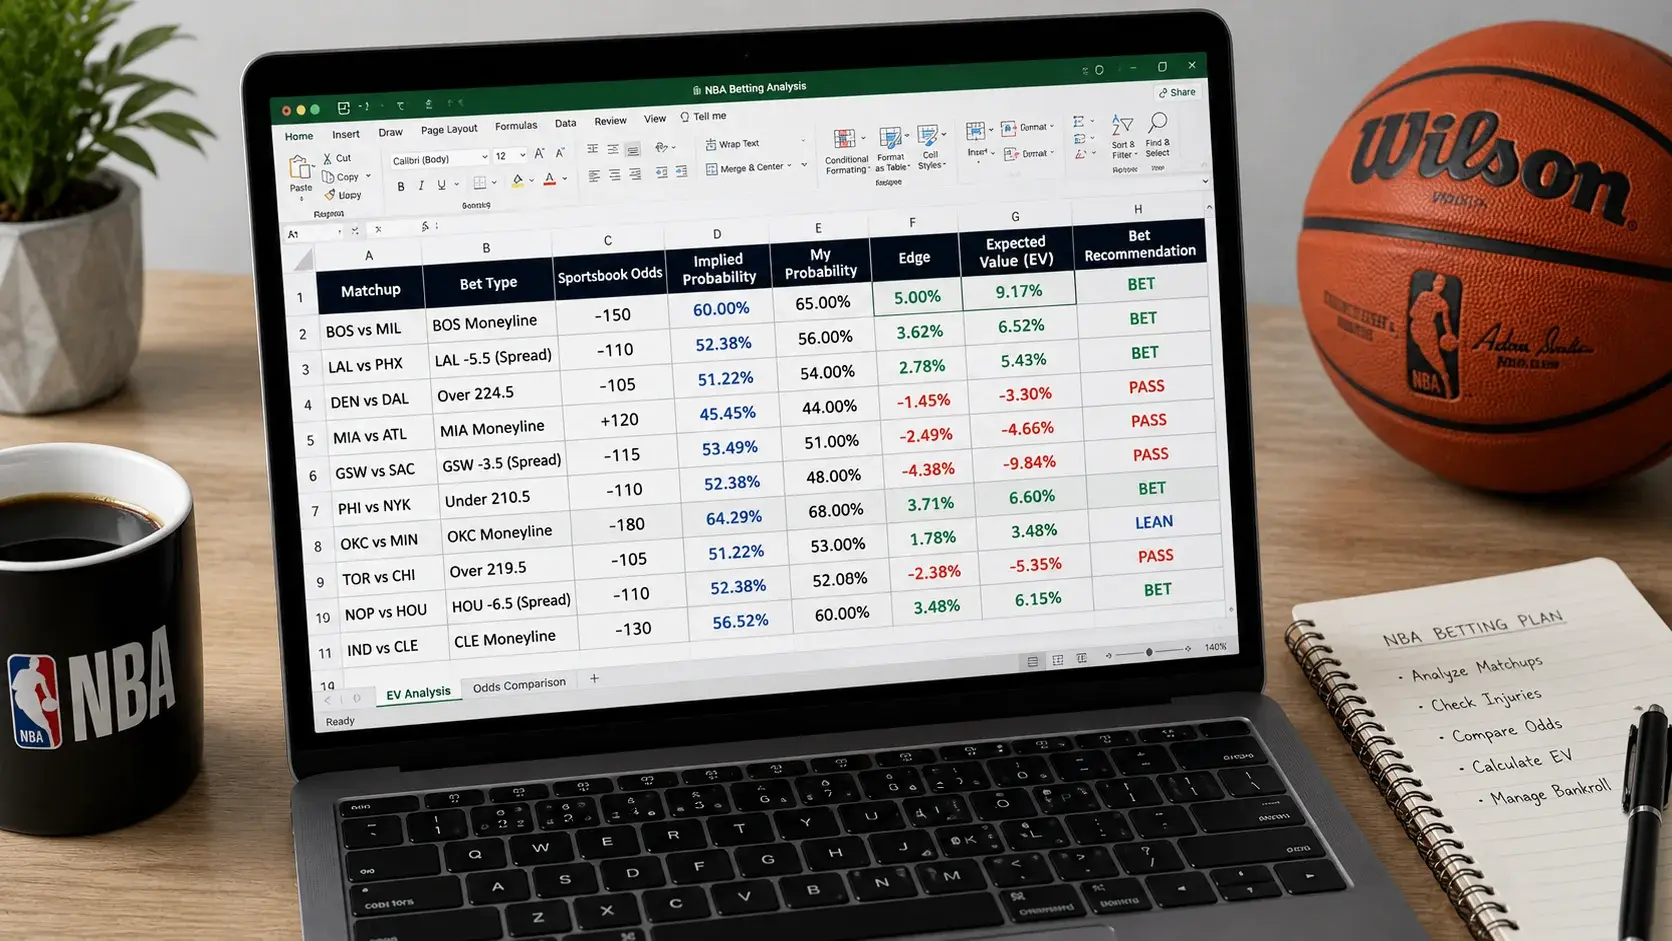
Evaluating True Pricing in NBA Betting Markets
I spent my first two years of NBA betting obsessing over picks and completely ignoring prices. I would back the team I thought would win, glance at the odds, and click confirm. My win rate was decent — 53% on spreads — but I was barely breaking even. The problem was not my selections. The problem was that I was placing bets at prices that did not offer enough value to overcome the bookmaker’s margin. The day I started evaluating expected value rather than just picking winners, my results transformed.
The average win rate for US bookmakers hit a record 9.7% in 2025. That 9.7% does not come from bettors picking poorly — it comes from the structural margin embedded in every line. Understanding expected value is the only way to identify whether a bet overcomes that margin, and it separates recreational bettors from those with a genuine chance at long-term profitability.
Expected Value in Two Minutes
Expected value measures the average profit or loss per bet over time. The formula is straightforward: EV = (probability of winning x profit if you win) minus (probability of losing x loss if you lose). A positive EV means the bet is profitable in the long run. A negative EV means it is not.
Here is a worked example. You believe the Bucks have a 55% chance of covering the spread at decimal odds of 1.91. If you bet ten pounds, a win returns 9.10 in profit and a loss costs 10 pounds. EV = (0.55 x 9.10) – (0.45 x 10) = 5.005 – 4.50 = +0.505 per bet. Over 100 identical bets, you expect to profit roughly fifty pounds. That is positive expected value.
Now change the assumption. If the Bucks only have a 50% chance of covering — which is what the odds of 1.91 roughly imply after the margin — EV = (0.50 x 9.10) – (0.50 x 10) = 4.55 – 5.00 = -0.45. Over 100 bets at negative EV, you lose forty-five pounds. Same bet, same odds, dramatically different outcome based entirely on whether your probability estimate exceeds the break-even threshold.
The Overround: How Bookmakers Build Their Edge
Every NBA market has a built-in bookmaker margin called the overround. On a two-way spread market priced at 1.91/1.91, the implied probability of each side is 52.4%. Add them together: 104.8%. The 4.8% above 100% is the overround — the guaranteed margin the bookmaker earns regardless of the result.
The overround varies by market type. Standard NBA spreads and totals carry overrounds of 4-5%. Moneylines on close games sit around 3-4%, while moneylines on heavy mismatches can push above 8%. Player prop markets often carry the widest overrounds — 6-10% is common — because the lower volume on individual props gives bookmakers more room to pad their margin.
The UK sports betting market generated $11.2 billion in 2024, and a meaningful portion of that revenue flows directly from overrounds. Every time you place a bet without calculating whether your edge exceeds the overround, you are donating to that revenue stream. The overround is not evil — it is how bookmakers stay in business — but it is a tax on every bet you place, and ignoring it is the most expensive mistake in sports betting.
Building Your Own Probability Estimates
Expected value is only useful if your probability estimates are accurate. If you believe the Celtics have a 60% chance of covering but the true probability is 48%, your EV calculation is positive but your bank balance will decline. Garbage in, garbage out.
I build probability estimates from three inputs. First, a statistical model that projects each team’s scoring output based on offensive and defensive ratings, pace, and home-court advantage. Second, contextual adjustments for schedule factors, injuries, and rest. Third, a market calibration step where I compare my estimate to the implied probability from the closing line. If my model says 58% and the market says 52%, that 6-point gap is potential value. If my model says 54% and the market says 52%, the gap is within the noise range and I pass.
The calibration step is critical because it prevents overconfidence. The market is right more often than any individual bettor, and my model’s advantage exists only at the margins. A gap of 3% or more between my estimated probability and the market’s implied probability is my threshold for placing a bet. Below that, the overround eats the edge. Above that, the expected value turns positive with enough margin to justify the bet.
Why Win Rate Alone Tells You Nothing
A bettor hitting at 55% on spread bets at average odds of 1.91 is profitable. A bettor hitting at 55% on accumulator legs at average combined odds of 4.00 is losing money. Win rate without odds context is meaningless.
The correct measure of betting performance is return on investment — total profit divided by total stake. A 3-5% ROI over a full NBA season of 500-plus bets is exceptional. A 1-3% ROI is good. Anything above zero over a large sample demonstrates genuine skill. The salary cap of $154.647 million for the 2025-26 season means NBA rosters are constantly in flux, and maintaining a positive ROI across seasons requires continuous model updates and adaptation.
I track ROI by market type separately. My spread betting ROI is different from my totals ROI, which is different from my player prop ROI. This granular tracking reveals which markets offer me genuine edge and which I should reduce or eliminate from my betting. If your props are bleeding value while your spreads are profitable, the rational response is to shift volume — not to try harder at the losing market.
The Long Run Is Longer Than You Think
Expected value is a long-run concept. Over ten bets, variance dominates. Over fifty bets, it still dominates. You need 500-plus bets at consistent EV before the signal emerges from the noise. An NBA regular season with 1,230 games provides enough volume for a serious bettor to demonstrate genuine skill — but only if you maintain your process through the inevitable cold streaks.
The 60% of UK gambling profits that come from 5% of problem gamblers is a reminder that the industry thrives on bettors who abandon process when variance hits. A ten-game losing streak on positive-EV bets is statistically normal. Twelve straight losses at 55% true probability is unusual but well within the range of expected outcomes over a 500-bet season. If you abandon your approach after a losing week, you never reach the long run where EV materialises into profit.
Patience is not a personality trait in this context — it is a mathematical requirement. The edge you identify through EV analysis only pays out if you execute it consistently across hundreds of bets. Stop too early, and you are just gambling with extra steps.